Additional information
Select Batch | Weekend Batch : 24th April, 08:30 AM To 12 PM ( 25 Seats Left), Weekday Batch : 12th May, 8 PM To 10:00 PM ( 20 Seats Left) |
---|
Introduction to Programming 3hr
What is a programming language ? Source code Vs bytecode Vs machine code
Compiler Vs Interpreter ,C/C++, Java Vs Python
Jupyter notebook basics 1hr
Different type of code editors in python introduction to Anaconda and
jupyter notebookFlavours of python.
Python Programming Basics 2hr
Variable Vs identifiers Vs strings, Operators Vs operand Procedure
oriented Vs modular programming
Statistics basics 2hr
Introduction to statisticsMean,median, mode, Standard deviation,
AverageIntroduction to probability,permutations and
combinationsIntroduction to linear Algebra
Git and GitHub 2hr
Learn the key concepts of the Git source control system,Configure SSH for authentication,Create and use a remote repository on GitHub,Git Overview
Tools Covered
Programming Basics &Environment Setup hr
Installing Anaconda, Anaconda, Basics, and Introduction, Get familiar with version control, Git, and GitHub.Intro to Jupyter Notebook environment. Basics Jupyter notebook Commands.Programming language basics.
Python Programming Overview hr
Python 2.7 vs Python 3,Writing your First Python Program
Lines and Indentation,Python Identifiers,Various Operators and Operators
Precedence ,Getting input from User,Comments,Multi line Comments.
Strings, Decisions And Loop
Control hr
Working With Numbers, Booleans and Strings,String types and
formatting, String operations Simple if Statement, if-else Statement
if-elif Statement. Introduction to while Loops. Introduction to for Loops,Using
continue and break.
Python Data Types hr
List,Tuples,Dictionaries,Python Lists,Tuples,Dictionaries,Accessing Values,Basic Operations,Indexing, Slicing, and Matrixes,Built-in Functions & Methods,Exercises on List,Tuples And Dictionary
Functions And Modules hr
Introduction To Functions – Why Defining Functions. Calling Functions
Functions With Multiple Arguments.Anonymous Functions – Lambda
Using Built-In Modules, User-Defined, Modules, Module Namespaces,Iterators And Generators
File I/O And Exceptional Handling and Regular Expression hr
Opening and Closing Files,open Function,file Object Attributes
close() Method ,Read,write,seek.Exception Handling, try-finally Clause
Raising Exceptions, User-Defined Exceptions. Regular Expression- Search
and Replace. Regular Expression Modifiers. Regular Expression Patterns,re module.
Data Analysis Using Numpy And
Pandas hr
Introduction to Numpy. Array Creation, Printing Arrays, Indexing, Slicing and Iterating, Shape Manipulation -Changing the shape, stacking, and splitting of the array,Vector stacking, Broadcasting.
Pandas : Introduction to Pandas,Importing data into Python
Pandas Data Frames, Indexing Data Frames, Basic Operations With Data frame,
Renaming Columns, Subletting, and filtering a data frame.
Data Visualisation using Python:
Matplotlib and Seaborn hr
Matplotlib: Introduction,plot(),Controlling Line Properties,Subplot with Functional Method, Multiple Plot, Working with Multiple Figures,Histograms
Seaborn :Intro to Seaborn And Visualizing, statistical relationships , Import and Prepare data.Plotting with categorical data and Visualizing linear relationships Seaborn Exercise
R programming hr
Installing R and R Studio,Setting up the environment,R Datatypes, Operators, Variables Coercion rules in R Functions and arguments Matrices Data Frame Constants,Data Inputs and Outputs with R,Vectors and Vector operation,Advanced Visualization,Using the script vs. using the console
Data Manipulation hr
Vector Manipulation & Sub Setting,List Manipulation, Sub Setting & Merging,Matrix Manipulation, rep fn & Data Frame,Data transformation with R – the Dplyr package ,Sampling data with the Dplyr package,Using the pipe operator in R Tidying data in R – gather() and separate(),Tidying data in R – unite() and spread(),Melting & Casting,String Manipulation with Stringi Package,Data Definition Language Commands,Data Manipulation Language Commands
Visualization in R hr
Introduction to ggplot2,Building a histogram with ggplot2,Building a bar chart with ggplot2,Building a box and whiskers plot with ggplot2,Building a scatterplot with ggplot2,Low Level Plotting,Timeseries Plots,Bar Plot & Density Plot,Combining Plots,MatPlot, ECDF & BoxPlot with IRIS Data set,QPlot, ViolinPlot, Statistical Methods & Correlation Analysis Set.Seed Function & Preparing Data for Plotting
Data Preparation hr
How to handle Missing Data,Data Filtering using is.na() and which(),Reseting the dataframe index,Replacing Missing Data,Median Imputation Method,Factual Analysis Method,Deriving Values Method,Visualizing results in R
Fundamentals of Math and
Probability hr
Basic understanding of linear algebra,Matrics, vectors. Addition and
Multiplication of matrics.Fundamentals of Probability
Probability distributed function and cumulative distributed function.
Descriptive Statistics hr
Describe or sumarise a set of data Measure of central tendency and
measure of dispersion.The mean,median,mode, curtosis and skewness. Computing Standard deviation and Variance.Types of distribution.
Inferential Statistics hr
What is inferential statistics,Different types of Sampling techniques
Central Limit Theorem,Point estimate and Interval estimate
Creating confidence interval for,population parameter
Characteristics of Z-distribution and T-,Distribution. Basics of Hypothesis
Testing. Type of test and rejection,region. Type of errors in Hypothesis yesting,
Hypothesis Testing hr
Hypothesis Testing Basics of Hypothesis Testing ,Type of test and Rejection Region,Type o errors-Type 1 Errors,Type 2,Errors. P value method,Z score
Method. The Chi-Square Test of, Independence.Regression. Factorial Analysis of
Variance. Pearson Correlation, Coefficients in Depth. Statistical,Significance, Effect Size
Data Processing & Exploratory
Data Analysis hr
What is Data Wrangling, Data Pre-processing and cleaning?
How to Restructure the data? What is Data Integration and Transformation
What is Time Series & Forecasting 8hr
Introduction,Forecasting model creation,Time Series – Basic Notations
Graphical Displays,Numerical Description of Time Series Data,Feature Engineering Basics Resampling,Use of Data Transformations and Adjustments,General Approach to Time Series Modeling and Forecasting, Evaluating and Monitoring Forecasting Model Performance,White Noise,Differencing ,Random Walk
Basic Properties,Linear Processes,Introduction to ARIMA Processes,SARIMA model,Test Train Split,Auto Regression Model,Spectral Analysis,Nonstationary and Seasonal Time Series Models,Multivariate Time Series,State-Space Models
Forecasting Techniques hr
The ARAR Algorithm,The Holt–Winters Algorithm,The Holt–Winters Seasonal Algorithm,Choosing a Forecasting Algorithm,Introduction to Neural Networks,Creating Perceptron model,Gradient Descent,Back Propagation,Hyperparameters
Transfer Function Models,Intervention Analysis,Long-Memory Models
Random Variables and Probability Distributions,Distribution Functions and Expectation,Random Vectors,The Multivariate Normal Distribution,Mean Square Convergence
Basics hr
Creating a New Workbook,Navigating in Excel ,Moving the Cell Pointer
Using Excel Menus,Using Excel Toolbars: Hiding, Displaying, and Moving Toolbars Entering Values in a Worksheet and Selecting a Cell Range ,Previewing and Printing a Worksheet Saving a Workbook & Re-opening a saved workbook
Formatting a Worksheet hr
Creating Headers, Footers, and Page Numbers,Adjusting Page Margins and Orientation,Adding Print Titles and Gridlines, rows to repeat at top of each page,Formatting Fonts & Values,Adjusting Row Height and Column Width,Changing Cell Alignment,Adding Borders ,Applying Colors and Patterns,Using the Format Painter
Merging Cells, Rotating Text Using Auto Fill
Managing your workbooks hr
Switching Between Sheets in a Workbook ,Inserting and Deleting Worksheets
Renaming and Moving Worksheets ,Protecting a Workbook ,Hiding Columns, Rows and Sheets,Splitting and Freezing a Window ,Inserting Page Breaks,Advanced Printing Options
Editing a Workbook hr
Entering Date Values and using AutoComplete ,Editing, Clearing, and Replacing Cell Contents Cutting, Copying, and Pasting Cells Moving and Copying Cells with Drag and Drop,Collecting and Pasting Multiple Items Using the Paste Special Command Inserting and Deleting Cells, Rows, and Columns Using Undo, Redo, and Repeat Checking Your Spelling Finding and Replacing Information ,Inserting Cell Comments
Formulas hr
Formulas Creating a basic Formula,Cell Referencing,Calculating Value Totals with AutoSum Editing & Copying Formulas ,Fixing Errors in Your Formulas
Formulas with Several Operators and Cell Ranges ,Conditional Formatting
Working with the Forms Menu hr
Working with the Forms Menu ,Sorting, Subtotaling & Filtering Data
Copy & Paste Filtered Records ,Using Data Validation
Creating & Working with Charts hr
Creating a Chart ,Moving and Resizing a Chart,Formatting and Editing Objects in a Chart,Changing a Chart’s Source Data,Changing a Chart Type and Working with Pie Charts,Adding Titles, Gridlines, and a Data Table ,Formatting a Data Series and Chart Axis,Using Fill Effects
Data Analysis & Pivot Tables hr
Creating a PivotTable ,Specifying the Data a PivotTable Analyzes,Changing a PivotTable’s Calculation,Selecting What Appears in a PivotTable ,Grouping Dates in a PivotTable ,Updating a PivotTable,Formatting and Charting a PivotTable
Automating Tasks with Macros hr
Recording a Macro
Playing a Macro and Assigning a Macro a Shortcut Key
RDBMS And SQL Operations hr
Introduction To RDBMS. Single Table,Queries – SELECT,WHERE,ORDER,BY,Distinct,And ,OR. Multiple Table
Queries: INNER, SELF, CROSS, and OUTER, Join, Left Join, Right Join, Full
Join, Union,Advance SQL Operations:Data Aggregations and summarizing the data
Ranking Functions: Top-N Analysis, Advanced SQL Queries for Analytics
NoSQL Databases hr
Topics – What is HBase? HBase Architecture, HBase,Components,Storage Model of HBase,HBase vs RDBMS,Introduction to Mongo DB, CRUD,Advantages of MongoDB over
RDBMS,Use cases
Grouping, Sorting, Aggregating hr
Count, Distinct, Sum, Min, Max, Avg,Group by, HAVING, Sort, Limit, ORDER BY, AS,Funnels, YOY revenue, and Sales by Location,Conditional Statements,Subqueries
VIEWS INDEXES
Mathematical Functions hr
CEIL & FLOOR,POWER,RANDOM,ROUND,SETSEED
Date & Time Functions hr
CURRENT DATE & TIME,EXTRACT,AGE
String Function hr
LENGTH,REPLACE,UPPER,LOWER,SUBSTRING,CONCATENATION,TRIM, LTRIM, RTRIM
PATTERN MATCHING,REGULAR EXPRESSIONS
Basics and CRUD Operation hr
Databases, Collection & Documents,Shell & MongoDB drivers,What is JSON Data
Create, Read, Update, Delet,Working with Arrays,Understanding Schemas and Relations
MongoDB hr
What is MongoDB? Charateristics, Structure and Features,MongoDB Ecosystem
Installation process,Connecting to MongoDB database,What are ObjectIds in MongoDb
Data Formats in MongoDB,MongoDB Aggregation Framework,Aggregating Documents
What are MongoDB Drivers?,Finding, Deleting, Updating,Inserting Elements
Introduction to Tableau hr
Connecting to data source Creating dashboard pages
How to create calculated columns,Different charts
Hands-on :Hands on on connecting data
source and data cleansing
Hands on various charts
Visual Analytics hr
Getting Started With Visual Analytics,Sorting and grouping Working with sets, set action,Filters: Ways to filter, Interactive Filters,Forecasting and Clustering
Hands-on: Hands on the deployment of Predictive
model in visualization
Dashboard and Stories hr
Working in Views with Dashboards and Stories,Working with Sheets
Fitting Sheets, Legends and Quick Filters, Tiled and Floating Layout Floating Objects
Mapping hr
Coordinate points,Plotting Latitude and Longitude
Custom Geocoding,Polygon Maps,WMS and Background Image
Basic Aggregations and Row Level vs. View Level Expressions
Basic Calculations vs. Table Calculations,Fixed vs. Include,Fixed vs. Exclude
Introduction to Dashboards,Navigating a Dashboard,Building the Dashboard
Device Customization,Formatting,Dashboard Creation,Building Stories
Getting Started With Power BI hr
Installing Power BI Desktop and Connecting to Data Overview of the Workflow in Power BI Desktop,Introducing the Different Views of the Data Mode,Query Editor Interface Working on Data Model
Import data from Excel files,Import data from CSV files,Import Real-time Streaming Data,Import from Web,Import data from SQL Server,Import Data from Folder,Import data from OData feed REST-API,Download and Install SQL Server Express,Download and Install Sample Databases,All about Data Flows
Programming with Power BI hr
Working with Timeseries,Understanding aggregation and granularity,Filters and Slicers in Power BI,Maps, Scatterplots and BI Reports,Connecting Dataset with Power BI,Creating a Customer Segmentation Dashboard,Analyzing the Customer Segmentation Dashboard,Waterfall, Map Visualization,Pie and Tree Map,Include and Exclude, Categories with no Data
Power Queries hr
Remove rows and columns,Create calculate columns,Make first row as headers
Change Data type, Replace Values and Rearrange the columns,Remove duplicates
Unpivot columns and split columns,Append Queries,Merge Queries
Power BI Visuals hr
PowerBI Visuals Introduction Visuals-Line Charts,Visuals-Pie Chart,Visuals-Bar Charts
Stacked bar Chart,Clustered Column Chart,Visuals-Combo Chart,Visuals-Treemap Chart
Visuals-funnel Chart,Visuals-Scatter Chart
Visuals-Gauge Card,Visuals-Matrix,Visuals-Table,Visuals-Slicers
Visuals-KPIs,Visuals-Maps
Visuals-Text boxes – Shapes – Images
Modelling hr
Creating your first report,Modelling Basics to Advance,Modelling and Relationship,Ways of creating relationship,Normalization – Denormalization OLTP vs OLAP,Star Schema vs Snowflake Schema
DAX using Power BI hr
What is Dax,Dax Data Types,Dax Operators and Syntax,Importing Data for Dax Learning,Resources for Dax Learning M vs Dax,Create a Column,Rules to Create Measures,Calculated Columns vs Calculated Measures,SUM, AVERAGE, MIN, MAX, SUMX, COUNT, DIVIDE, COUNT, COUNTROOMS, CALCULATE, FILTER, ALL
Time Intelligence hr
Create Date Table in M,Create Date Table in DAX,Display Last Refresh Date
SAMEPERIODLASTYEAR,TOTALYTD,DATEADD,PREVIOUSMONTH
Project :Indian Road Analysis
Find out how much investment is requirement in national highways to meet its economic needs as a part of infrastructural development as the road network of India is second largest road network in The World.
Project : Credit Card Eligibility of Customers
Study how Predictive Analytics will be implemented to evaluate a customer’s ability to repay and whether or not they can be given a credit card.
Project : Netflix Movies and TV Shows
Explore what all other insights can be obtained from the list of tv shows and movies available on Netflix. Network analysis of Actors / Directors and find interesting information.
Project : Predictions for app ratings on the Google Play store
Create a model to forecast an app’s rating, along with other app-related details to increase the app’s exposure.
Project : Smart Supply Chain
A DataSet of Supply Chains used by the company DataCo Global is used for the analysis. It also allows the correlation of Structured Data with Unstructured Data for knowledge generation.
Project : Forecasting Uber Demand
Create an interactive dashboard using Tableau, used to get historical insights into a neighborhood. Ex, see upcoming forecasted demand, increase the accuracy, decrease surge pricing events.
Project : IBM HR Analytics
Applying analytic processes to the human resource department of an organization in the hope of improving employee performance and therefore getting a better return on investment.
Project :Consumer Reviews of Amazon Products
The goal is to analyze Amazon’s most successful consumer electronics product launches, discover insights into consumer reviews.
Learnbay’s Data Analytics Course in Mumbai is an ideal learning environment for both professionals and non-professionals interested in data analytics. We provided expert training in data analytics, data engineering, advanced computing, programming, artificial intelligence, machine learning, and deep learning, among others. Our data analytics certification training in Mumbai is one-of-a-kind. Our interactive Data Analytics course covers all pertinent topics.
We give skilled Data Analytics training to interns, entry-level data analysts, data analyst pros, and amateurs. Our fundamental data analytics training covers programming fundamentals, machine learning algorithms, Tableau and PowerBI, big data and spark analytics, Hadoop, Python, statistics, natural language processing, TensorFlow, Decision Tree, Deep Learning, SQL and MongoDB, data visualisation, training and deployment of machine learning models using GCP, and real-world industry projects.
Do not be concerned about the cost of the data analyst course. Learnbay is committed to providing the best data analytics training in Mumbai. Additionally, we aid individuals in securing excellent job profiles through our Job Assistantship programme. Here comes the best data analytics institute in Mumbai, Learnbay, a one-stop shop for all your data analytics needs. We are the city’s newest and most reputable data analytics institute. Gain access to our programmes and also learn about business analytics courses in Mumbai with elective domain specialisation.
The application of Data Science and its subdivisions is referred to as Data Analytics. In a nutshell, data analysis is the collection, purification, transformation, and modelling of data. The objective of this method is to collect meaningful data and draw conclusions. Ultimately, the idea is to construct models that aid in decision-making.
Data analytics comes in various flavours, including descriptive analysis, prescriptive analysis, and automated data analytics. Automated data analytics is the process of utilising computer systems to execute various analytical activities without human intervention. A data analyst in Mumbai is familiar with these fundamental notions regarding the many types of data analytics and how to apply them in appropriate professional sectors.
Indeed, a data analyst working in Mumbai should have basic foundational knowledge as well as the knowledge of applying the algorithms to find meaningful information. Also, complete knowledge of data science and the methods of retrieving data is mandatory for the role of a data analyst. Of course, must clean the data and interpret meaningful information. Definitely, their main job is to find meaningful patterns in the data and apply them to a suitable business model for profits.
Also, data analysts are preferred in lead roles at start-ups and established MNCs. Certainly, they often take up the job of data scientist, business analyst, machine learning engineer, database engineer, big data analyst, artificial intelligence engineer, data engineer, and much more similar roles. Indeed, Mumbai demands data analysts with proficient skills and knowledge of different data analysis modules.
Anyone can enrol in the Data Analysis course in Mumbai offered by Learnbay, the leading Data Science college in the city. Working professionals with a minimum of one year of professional experience in any domain, programming or non-programming, are eligible to enrol in the Data Analytics course. We offer specialised training for programmers and core AI and machine learning engineers.
College graduates interested in data science and analytics can enrol in a Data Science foundation or domain specialisation course to learn everything from the ground up. Any university student is also eligible to enrol in weekday or weekend classes.
We provide learners with a great deal of freedom in selecting data analytics mentors at our institute. Our institute is currently preparing to develop world-class data analysts of the highest calibre. We are wholly committed to teaching each student with the utmost dedication. Give Learnbay, Mumbai’s premier data analytics institute, a call today.
Enrolling in a data analytics course in Mumbai at the city’s premier data analytics institute may turn out to be the best choice of your life. We express this confidence as a result of the inherent benefits and news.
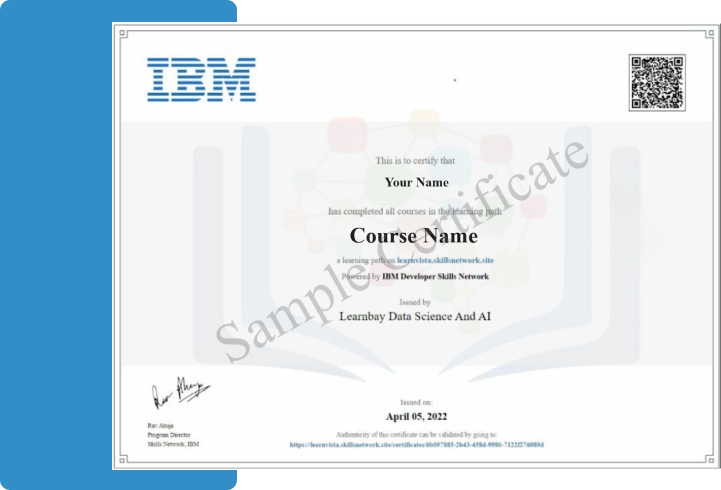
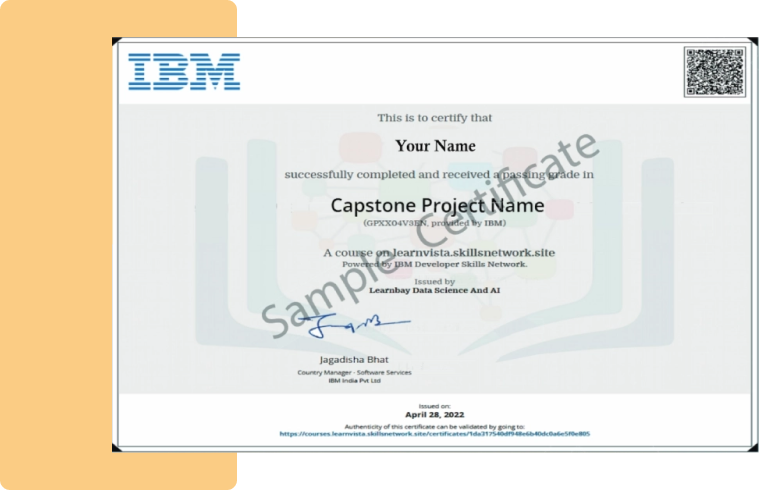
Additionally, Learnbay is one of the leading data science training institutes in Mumbai, offering data analytics and data science courses. It delivers comprehensive training and services in a condensed period. Our data analytics institute in Mumbai is well-known for its career counselling services. In conjunction with IBM, we offer a data analytics certification.
Obtaining a degree for online data analytics training in Mumbai is as simple as following simple steps. You can earn certification in the data analytics course in Mumbai by consistently achieving high evaluation marks. You may be eligible for job aid and get employed by large organisations in Mumbai and around India.
Our artificial intelligence courses are built on industrial requirements. It is the technique of informing computer systems regularly to improve model development. In a nutshell, it is a form of technology in which machines behave like people.
Machine learning is a subfield of data analysis that is highly specialised. It permits the modification of computer system operation while continuously learning new information from data. It is a subset of artificial intelligence that is exclusively concerned with massive volumes of data. A typical application in today’s information technology world.
For data analysis, artificial intelligence, machine learning, and deep learning methods are critical. Learnbay’s data analytics courses are popular among Mumbai’s industries.
Learnbay data analytics certifications in Mumbai offer budding data analysts Artificial Intelligence and Machine Learning courses in Mumbai. Learnbay data science Institute ensures that candidates receive customised data analytics training based on their needs and eligibility.
Surely, Learnbay is one of the best data science institutes in Mumbai since it is best suited for:
Learnbay is one of the best Data Analytics Training Institute in Mumbai. The sessions are conducted Live-Online.
Indeed, the data grows on innovation. Also, they are abandoning or rebuilding time-consuming procedures to meet new company expectations. Surely, as procedures evolve, so does the amount of data generated. Certainly, companies have massive data sets. As a result, their firms can thrive if they utilize this data correctly. If not, they’re doomed. Ultimately, one false action and a data could be shut down.
That’s why Data intelligence matters. Indeed, analytics aid in commercial decision-making. It enables corporate agility. Again, technology cannot make Data decisions. Prior to the advent of Data analytics, organizations were forced to rely on inaccurate analytical models, which made it impossible to make more informed decisions. Also, they have been able to make more informed selections with a higher degree of predictability. Indeed, to make things work in your favor, you need human brains with expert knowledge and Data analytic skills. Also, this is where a Data analyst comes in. Surely, the data analytics course in Mumbai is required to master the required Data analytics skills.
As a result, there are several benefits to Data analytics, and we’re going to highlight a few of the more notable ones:
Certainly, it is critical to understand who contributes to your business’s success, it would be unwise to leave the subject at that. Indeed, your business’s values must be quantified and communicated in such a way that they increase your organization’s revenues.
Surely, possessing quantifiable values enables a corporation to strengthen its analytical process by providing a measurable target to work toward. Also, your business has a well-defined strategy, everyone in the organization can work toward achieving it.
Definitely, your employees can evaluate the measurable values of your business to gain a better understanding of what you expect of them. Surely, the more clearly they comprehend your business’s objectives, the more effectively they will operate. Indeed, it is one of the most significant business analytics benefits.
Surely your organization has access to critical data, it enables you to make more informed decisions that result in improved performance. Indeed, Business analysts give useful and relevant data to your organization, enabling it to make data-driven choices.
Additionally, business analysts enable you to easily share your insights and strategies with your staff and stakeholders. As a result, it fosters collaboration among all stakeholders in your business, enabling you to achieve your objectives more quickly and efficiently.
Indeed, one of the key benefits of business analytics is that it enables you to acquire crystal-clear insights via data visualization. Also, the term “data visualization” refers to the process of visually expressing data and its insights using visuals or graphics such as pie charts, graphs, and so on.
Definitely, utilizing thorough graphs and charts can significantly improve the efficiency of your decision-making process. Indeed, you can quickly extract data from them, spot trends in your data, and generate more relevant and actionable insights.
Certainly, consumers in the present era have a limited attention span. Surely, they move fast from one firm to the next, completely forgetting about the prior one. However, a business analytics professional can help you avoid this.
Indeed, marketing analytics is a significant subfield of business analytics that focuses on discovering patterns in consumer behaviour. As a result, it helps in gaining a better understanding of the target audience’s behaviour processes. Also, it provides vital insight into how people select a firm. Andy why they prefer one over another. Also, what products/services attract them, and their pain issues, among other things.
Definitely, these insights might assist you in developing more effective marketing plans and tactics to sell your items (or services). Also, when you understand your target, you can tailor your message to meet their specific needs and capture their attention.
Therefore, it is a well-known fact that the modern industry is quite dynamic. Indeed this type of dynamic is highly unpredictable, business analytics will help you stay on top of your game by creating accurate future projections.
Indeed, it will help you understand values and convert them into business solutions. Also, these qualities, when quantified, can help a company expand its business proposition in real-time. Therefore, a data analyst at the workstation leaves nothing to chance. Certainly, you help your firm use data to support its beliefs.
Indeed, you can learn how to interpret visual data in your analytics course. Also, visual data analysis can forecast more agile and faster trends. Certainly, based on recent market trends, you can rapidly determine what will work and what won’t. Therefore, making educated judgments faster than ever before makes charts and graphs a breeze.
While taking a business analytics certification course training, you need to keep learning from your practical experiences.
In addition to all these benefits, the machine learning and artificial intelligence course in Learnbay Bangalore provides amazing offers and scholarships. Reduce your course fee by availing of the early bird offer.
The data analytics course training fees in Mumbai depend on the program or course you choose to study. The fees for different data analytics courses in Mumbai are mentioned below:
Advanced training in machine learning and artificial intelligence is available through the Data Analytics programme in Mumbai. Indeed, Learnbay has pioneered various Artificial Intelligence techniques. Our Machine Learning and Artificial Intelligence courses in Mumbai have assisted Data Scientists in developing the following essential abilities for the job in various domains.
Expertise in programming languages
Our Data Analytics professionals are trained to work well with various computer languages, including Python, C++, Java, JavaScript, Shell, TypeScript, Scala, and R. Each Data Science industry requires a high level of coding proficiency. Learnbay’s curriculum complies with this.
Acquiring data engineering skills
Another effective data science talent is the ability to preprocess and store data. A data scientist capable of creating, extracting, transforming, and developing pipelines for data purification and storage is required. Industrial initiatives at Learnbay assist students in developing their data engineering skills.
Enhancing data analytics abilities
The most crucial data science talent, practically speaking, is data analysis. While data collecting takes time, using the necessary algorithms to discover valuable patterns is similarly time-consuming. Data representation in graphical forms such as histograms, box plots, and heat maps is also required. A data fanatic with data analytics abilities can easily handle all of these tasks. Learnbay’s data science curriculum includes specialised instruction in data visualisation. Additionally, develop business analytics abilities for domain expertise.
Development of AI/ML models
After completing a machine learning course in Mumbai and being familiar with AI techniques, a data scientist would be proficient in utilising this knowledge base. They can use the programmes to establish linkages between disparate datasets. The development of models necessitates extensive training and testing. A data scientist’s primary responsibility is to create the appropriate models for data analytics.
Constructing models and assuring their security
After developing a machine learning model, it is critical to determine whether it is suitable for implementation. While deploying a machine learning model, several critical factors must be considered. The performance, scalability, fault tolerance, availability, and resiliency criteria are used.
Another critical part of data science education is software security. Securing machine learning models necessitates extensive training, and access to authorised employees is critical. A data scientist can acquire these competency skills at an affordable data science course charge with Learnbay.
Learnbay provides mock interviews and job assistance to aspiring Data Analysts in Mumbai. We assist people in Mumbai with resume writing, interview preparation, and selecting the appropriate job profile. Our strong relationships with multinational corporations and information technology firms come in handy for bulk placements. Therefore, all you need to do is sit back, take classes, and relax while we take care of the rest!
Get enrolled in the Data Analytics training in Mumbai or Data science online training in Mumbai by contacting our counseling team. Pay the Data Analytics course fees with 0% EMI on Major credit cards. Please check with our sales team to know how 0% EMI on credit cards works.
Data Analytics course fees in Mumbai are lowered with our promotions and early bird offer from time to time. The amazing applicable discounts offered to Data Analytics enthusiasts are as follows:
Group Discount: Group discount is applicable if you are joining with your friends.
range of specialized courses and training to different groups of learners such as Best Business Analytics AI Course Tools. At Learnbay, we provide Business Analytics Fundamentals in fresher programs. You can visit our website for course descriptions and Business Analytics projects for each program in detail
Yes, the Business Analytics course in Mumbai offered by Learnbay data science institute is suitable for freshers, college-going students, managers, and working professionals. We offer a range of specialized courses and training to different groups of learners such as Best Business Analytics AI Course Tools. At Learnbay, we provide Business Analytics Fundamentals in fresher programs. You can visit our website for course descriptions and Business Analytics projects for each program in detail.
Learnbay Data Science Institute provides data analytics training in Mumbai along with a special feature of job assistance. We help data Analytics enthusiasts to get through job interviews and resume preparation. Our strong relations with corporates and the IT industry helps in bulk data scientist placements. We ensure to support candidates after the course completion. Career counseling and interview preparation are our major concerns for each and every candidate. Getting placed in a firm depends on the ability of the candidate to crack mock interviews and obtain good scores during regular assessments.
Learnbay is an ideal data Analytics course institute in Mumbai. We are one of the best data science learning institutes in metropolitan cities such as Mumbai. The primary focus of Learnbay is to:
IBM and Learnbay have joined hands to provide an intensive data Analytics learning course to aspiring data scientists in Hyderabad and other parts of the country. IBM and Learnbay work together to fulfill the following goals:
In which areas of Hyderabad is the Data Analytics course conducted?
The Data Analytics courses online by Learnbay are conducted in online mode. The live data analytics course online classes are accessible to our online learners in Hyderabad.
What is the total duration of this Data Analytics course in Hyderabad?
The duration of this Business Analytics course in Hyderabad varies and depends on the type of Business Analytics course one chooses. The maximum duration of a Business Analytics course in Hyderabad is 6 months to 12 months. It includes live lectures and hands-on practical training on industrial projects. The lectures are accessible even after a year of course completion.
Can I pursue a Data Analytics course in Hyderabad after my graduation?
Yes, you can pursue a data analytics course in Hyderabad after graduation. You can choose the foundation program or the freshers program depending on your needs. We also have a special course in data Analytics for professionals.
The eligibility for the data analytics course in Mumbai are:
How many programming languages will I learn in this Data Analytics course in Mumbai?
The programming languages taught in the Business Analytics course in Mumbai are- Python language and R language, mySQL, and others. Special attention is paid to these two languages due to the high demand for model training.
What are the important features of the Learnbay Data Analytics course in Mumbai?
The important features of the Learnbay data Analytics course in Mumbai are:
Mumbai is home to a diverse spectrum of heavy and light industries, as well as high-tech and service sectors such as information technology (IT) and electronics, telecommunications, and corporate finance.
Mumbai is one of India’s IT centre and is frequently referred to as the Cyberabad, which means that opportunities for a data scientist are abundant.
How to Become a Data Science and Business Analyst in Mumbai?
To pursue a career in data science and business analysis, please enroll in Learnbay’s data Analytics training course in Mumbai. The Data Analytics course in Mumbai will benefit you to master data Analytics skills and will help you to handle interviews with more confidence if you are looking for a job in the data science domain.
How to Find Data Science and Business Analytics in Hyderabad?
This Data Analytics certification training provides hands-on experience with essential technologies such as R, Python, Machine Learning, Tableau, Hadoop, and Spark through live interaction with practitioners, practical laboratories, and industry projects. Kindly visit Learnbay and enroll in the course immediately.
Why Get Certified as a Data Analyst?
Should I get a data Analytics certification? It’s the most perplexing question that every aspiring data scientist must confront. This is followed by additional queries – Will it boost the weight of my resume or will it assist me to land a job? This ultimately results in increased stress and confusion.
A data analytics certification undoubtedly has a number of advantages. It demonstrates your love and passion for data analytics, but there is a caution — due to the surge in data science, many courses have become widespread or general.
According to Payscale, a Business analyst salary in different metropolitan cities of India are as follows:
City | Pay Scale |
---|---|
Mumbai | ₹628236 per annum |
Chennai | ₹579728 per annum |
Bangalore | ₹703692 per annum |
Hyderabad | ₹600758 per annum |
Pune | ₹744094 per annum |
Kolkata | ₹639330 per annum |
It is self-evident that Hyderabad offers greater prospects for the growth of a data scientist. Learnbay’s data science course will equip you to apply for any data Analyst job across India or anywhere else in the world.
Throughout the world the data analyst salaries vary as follows:
City | Pay Scale |
---|---|
United States | $69888 USD per annum |
United Kingdom | £36384 per annum |
Canada | C$66669 USD per annum |
Australia | AU$81974 per annum |
Singapore | S$62097 per annum |
New Zealand | NZ$80,000 per annum |
South Africa | R389810 per annum |
To differentiate yourself from the competition, you’ll need to register in a course that exposes you to industry professionals and involves you in high-quality projects. Certification is used as a yardstick for measuring exceptional talent.
As our courses include an IBM data Analytics professional certification, they take things a step further.
Will this Data Analytics course in Hyderabad help me to learn Data Analytics from scratch?
We pride ourselves on being the best data Analytics institute in Hyderabad. As part of our Data Analytics certification course, we provide a specialized non-programming domain course that requires no prerequisites and begins with the fundamentals.
How will I receive Data Analytics course material after joining?
After you make the payment, you will receive an email confirming your successful enrollment. It will outline how to obtain the Business Analytics course materials. By following the steps, you may quickly go through the video lessons
What are the top online Data Analytics courses in Hyderabad Telangana provided in this certification program?
The Business Analytics course fees in Hyderabad depend on the program or course you choose to study.
Flexible Two-Year Subscription
I am not able to access the online Data science courses in Hyderabad. Who can help me?
Contact us via the form on the right side of any Learnbay page, the Live Chat link, or by contacting Help & Support.
Is Data Analytics a good career in Hyderabad?
Businesses are embracing digital transformation, and the increased reliance on data makes a career in data science quite lucrative. Businesses are ramping up their digital activities, and AI abilities will continue to be in high demand in the foreseeable future. Extensive use of business analytics has been observed in the past few years. Business analytics plays a key role in surplus growth and profits. Additionally, given the current skills shortage, businesses are willing to offer business analysts greater wages. You can qualify for this rewarding job with Learnbay’s Business Analytics course.
Can a fresh graduate seek employment after completing this Data Analytics course in Hyderabad?
A fresher can become a Business Analytics expert if he or she learns the trade secrets and works on polishing the necessary abilities. To get started, rookies must plan on how they will stand out in the field and keep up with individuals who already have relevant expertise in the profession. Learnbay’s Business Analytics and ML certification teaches new graduates all of the essential data analyst skills and prepares them for the workforce by requiring them to work on real-world projects.
Is Data Analytics easy to learn in Hyderabad?
Since the abilities required to conduct Data Analyst positions can be quite technical, data analysis can occasionally be more difficult to learn than other sectors of technology. However, with the present global lack of data specialists, the function of Data Analysts is in high demand, which means increased compensation and job security. According to a 2017 IBM analysis, demand will climb another 28% by 2020, adding 364,000 jobs (to 2.7 million), substantially boosting demand. However, this Data Analytics course in Hyderabad covers all pertinent ideas in detail, making it simple to put your new Data Analytics skills to use.
₹65,000.00
IBM certified Business Analytics & Data Analytics Program For Working Professional to Change Your Existing Domain and start your career in Business Analytics .This course will benefit you to master data science skills and will help you to to handle interview with more confidence if you are looking for job in data science domain.
Select Batch | Weekend Batch : 24th April, 08:30 AM To 12 PM ( 25 Seats Left), Weekday Batch : 12th May, 8 PM To 10:00 PM ( 20 Seats Left) |
---|