Curriculum inclusive of Gen-AI
Data Analytics Certification Program for Non-Tech Professionals
Upskill yourself to the top within 6 months with curriculum designed by industry experts
In Collaboration With
Free Career Counselling
IBM
Certified Capstone
175%
Average Salary Hike
35K+
Trusted Learners

Job Roles You Can Target
Sr. Data Analyst : 15 LPA
BI Developer : 10 LPA
Database Admin : 13 LPA
Dedicated Job Assistance
Data-Driven Brilliance

From Beginner to Data Master
Become an expert data professional & gain in-demand analytics skills.

Flexible Learning at your Convenience
Designed for professionals aiming to upskill without quitting their job

Achieve Your Dream Role
Get your dream salary package in your dream company


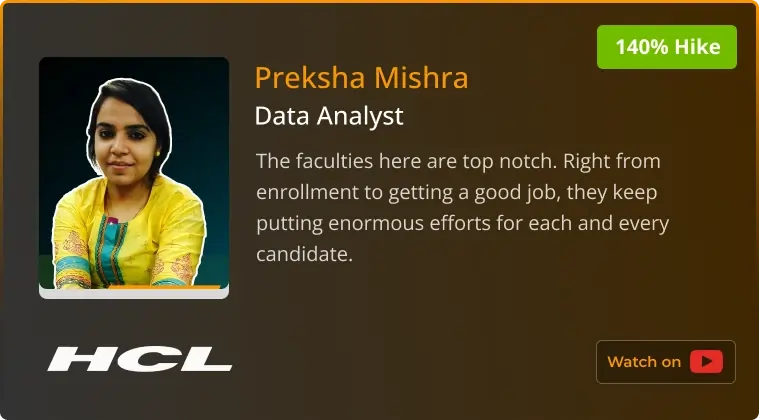
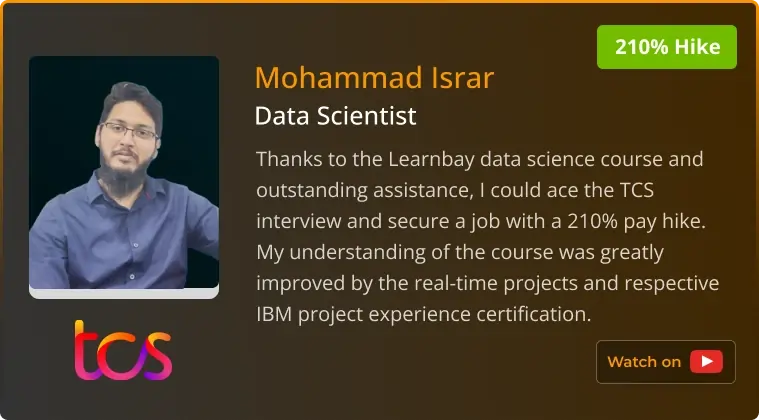
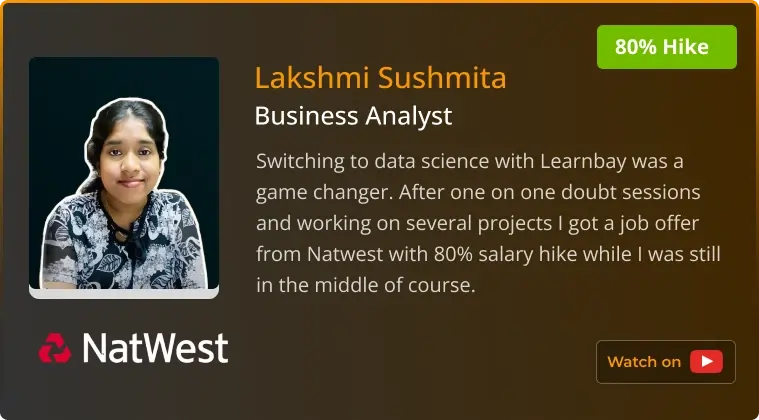
Real Stories, Real Success
Discover what our learners say about us


9K+
Successful Career Transitions
175%
Average Salary Hike
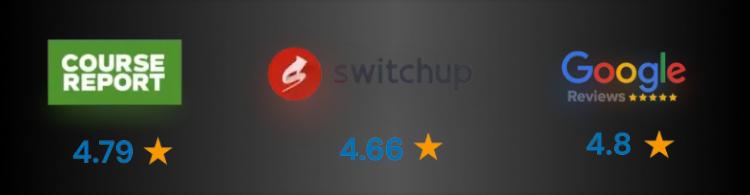
Courses Top Rated in:
Discover what our learners say about us


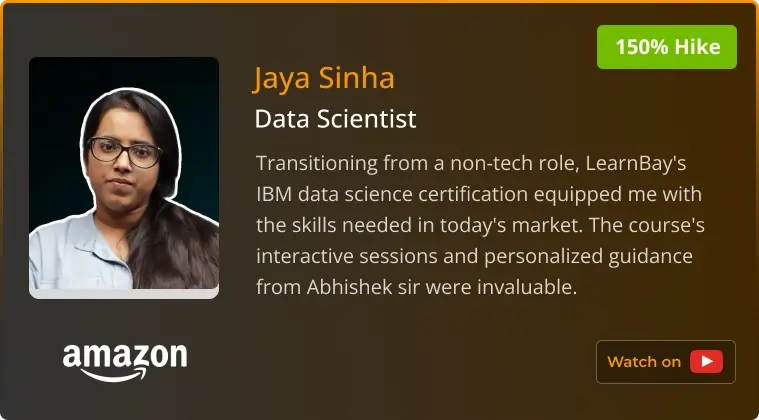
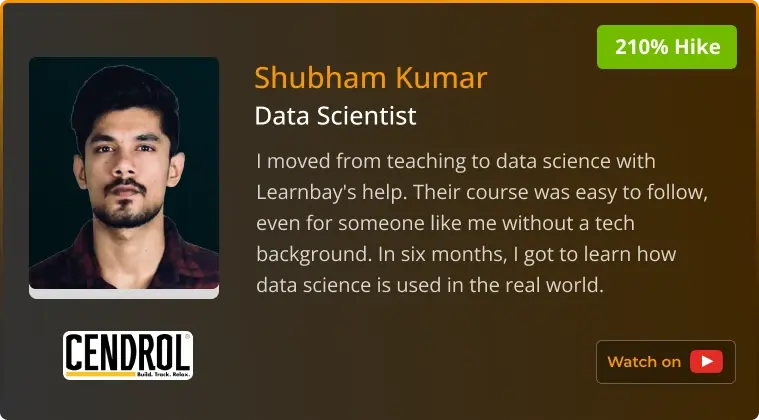
Hear it from Alumni

Alumni Spotlight

Who is this program for
Education
Bachelor's degree with consistent good academic
Work Exp.
Minimum 6 Month of IT/Non-IT work experience
Career Stage
Early to mid-career professionals interested in data analytics
Aspirations
Developing skills in data analytics for future opportunities
Land Your Dream Job with Career Services PRO
1:1 Doubt Sessions
Interview Prep.
Resume BuildUp
3 Years Flexible Sub.

GetHired At
Can’t decide which program to opt for?
Don’t worry, our expert counsellor is there to guide you make the right career choice

Learning journey at Learnbay


Upskill Now
Live sessions, expert 1:1 doubt clearing, and quizzes.Capstone Projects
Work with industry experts on practical projects.Boost Profile
Mock interviews and resume-building sessionsCareer Goals
Get placement assistance with top companies.Explore our Syllabus
Curriculum is specifically engineered to meet the expectations of leading tech companies

Module 0 :- Preparatory Classes (Programming + Maths)
Topic 1 :- Cohort Orientation
Topic 2 :- Fundamentals of Programming
Topic 3 :- Fundamentals of Statistics


TERM 1 :- Python Programming

TERM 2 :- Statistics and Machine Learning

TERM 3 :- Data Analytics Tools

TERM 4 :- Excel
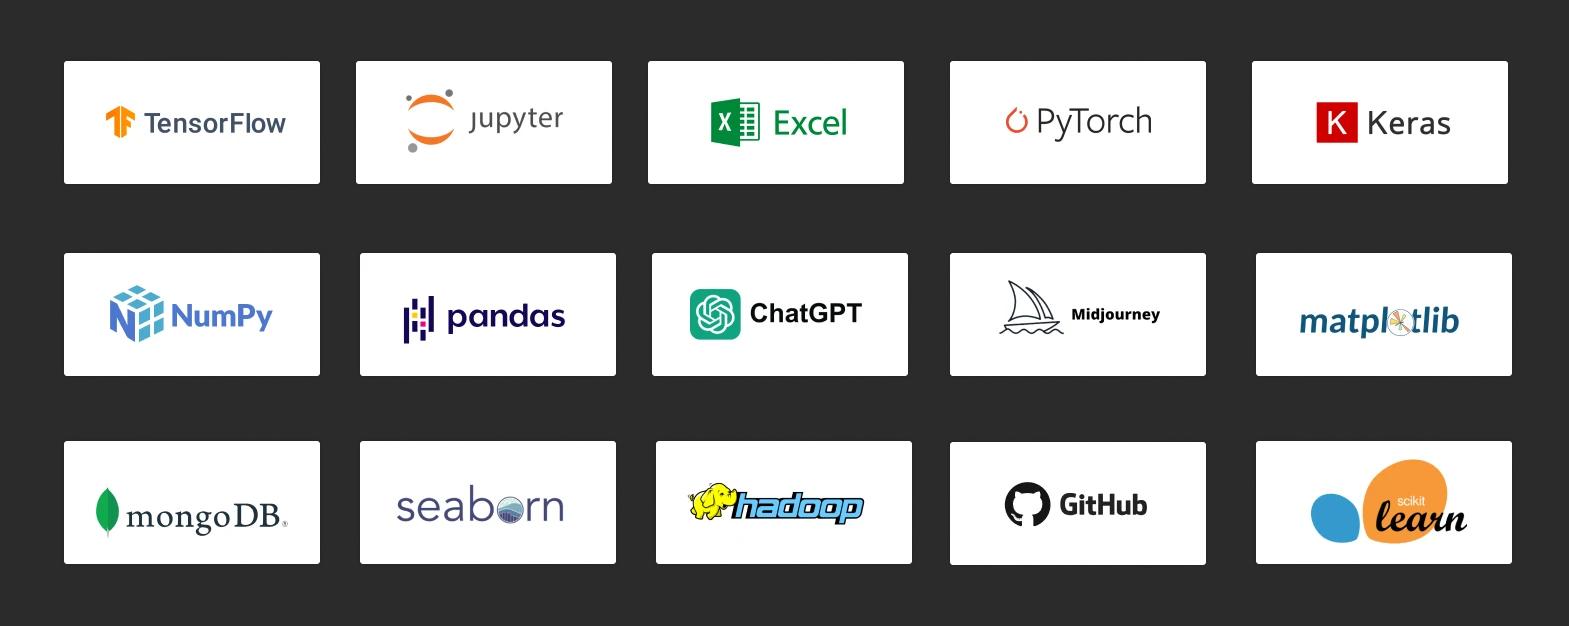
Programming Languages & Tools Covered
.webp&w=828&q=75)
Industry Recognized Certification Course
Course Completion Certificate from IBM
Complete your training with the internationally recognized certificate.
Validate your Data Analytics skills with IBM Course Completion Certificate.
Get acknowledged in IT sector by adding IBM Certificate to your profile.

Fee & Batch Details
Scholarship Details

Scholarships are awarded based on profile review. Eligible candidates can avail upto 25% scholarship on desired program. Click the button below to apply.
Program Fee
₹1,20,000 + 18% GST
Meet Our Mentors
Guiding You Every Step of the Way Towards Professional Excellence
Disha Jindgar

Disha M.

Tammanna V.

Mohit S.

Pulkit Jain

Tripti Jain

Ankur K.
Get job ready within 6 months with Career Services
Placement Support
Placement Support
Unleash your career potential with interview support and profile review.
Receive 8-10 interview calls from a diverse pool of interested employers/recruiters until you successfully secure a job.
Find the best suited job role that meets your career and salary expectations.

Mock Interviews
Resume BuildUp
8-10 Interview Calls
Placement Support
Unleash your career potential with interview support and profile review.
Receive 8-10 interview calls from a diverse pool of interested employers/recruiters until you successfully secure a job.
Find the best suited job role that meets your career and salary expectations.
Dedicated Placement Cell
Job roles & companies you can target
Sr. Data Scientist
ML Engineer
AI Engineer
BI Engineer
BI Developer
Sr. Data Analyst
Business Analyst
DataBase Admin


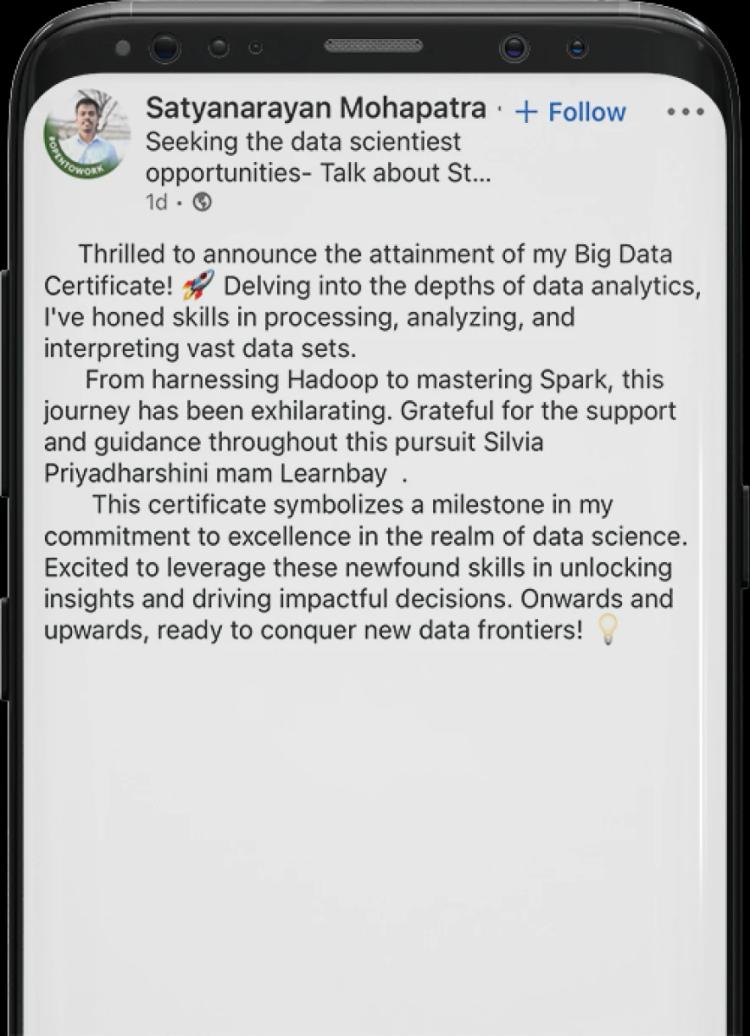
Insider glimpses: Click to see real conversations with our learners


Industry Projects
Curriculum is specifically engineered to meet the expectations of leading tech companies.
-min.png&w=640&q=75)
Learn and develop classification techniques for the digital transformation of banking
JPMorgan offers tax-friendly insurance choices. You can help them forecastinsurance premiums. Targeted marketing using your random forest algorithm skills can help obtain better premium values.

Building a content recommendation model on the basis of regional viewer categorization
Netflix is a global entertainment video streaming site. They offer content in various regional languages. Build a local recommendation engine for Netflix customers residing in south Bangalore on their weekend and weekdays activities, utilizing NLP.


Understanding in-depth about logging while drilling (LWD) technique
Saudi Aramco company is working onthe development of high-efficiency drilling models. Use the bright sides of big data analytics to identify the most cost-effective and highly productive drilling sites.


Career progression planning of employees with workforce defections & efficiency
IBM intends to boost its HR department by identifying employees' masked inconsistency. They need models to identify the graphical variations in their 14000+ employees' performances. Help them build models with your regressions and other ML abilities.

FAQs
Curriculum is specifically engineered to meet the expectations of leading tech companies.
What are the prerequisites for the Data Analytics?
What if I miss a few classes due to an emergency?
In case you miss a few classes, you will be provided with backup classes in other batches. But if you could not attend more classes, you can opt for batch change and join the next batch.
What is a Flexi Subscription in the Data Analytics Program?
Those who enroll for Data Science live classroom training are eligible for a Flexi Pass. With this option, we will share access to all the ongoing batch details for a period of 2 years, so that you can attend live sessions from any batch and learn at your own pace. This option is best for people working in shifts or on weekends.
What’s the duration of the Data Analytics Program?
The duration of this course is about 9 months (275 hours) which includes live lectures, hands-on practical training on live projects, and interview preparations. Classes will be conducted on weekdays and weekend batches. Weekday batch – 7 months, Monday to Friday – 2 hours/day, Weekend batch – 9 months, Saturday & Sunday – 3.5 hours/day
What is the mode of training at Learnbay?
We provide both classroom and online data science training modes. Based on your requirement, you can choose your preferred mode.
How can I opt for a Hybrid mode of learning?
Simply, you can choose an online mode of study for the theoretical classes and classroom mode for all the capstone projects and interview preparation sessions.
Upskill Yourself with Data Analytics Course Online
Boost your career with Learnbay’s Data Analytics Program to land on the field of endless opportunities. Enroll in an industry-paced online data analytics certification in association with IBM. With existing domain knowledge, this course brings the massive privilege of having a job-ready future. From flexible learning platforms to 100% placement assistance, this course enhances your career to future-proof success.
Read More...
24X7 Learner’s Support